

TestStrainAttendanceVideo & Messages
One system for test results, training load, attendance, and match footage — instead of a scattered set of spreadsheets and group chats.
Five areas, one login: testing, training load, attendance, game video, and communication with athletes.
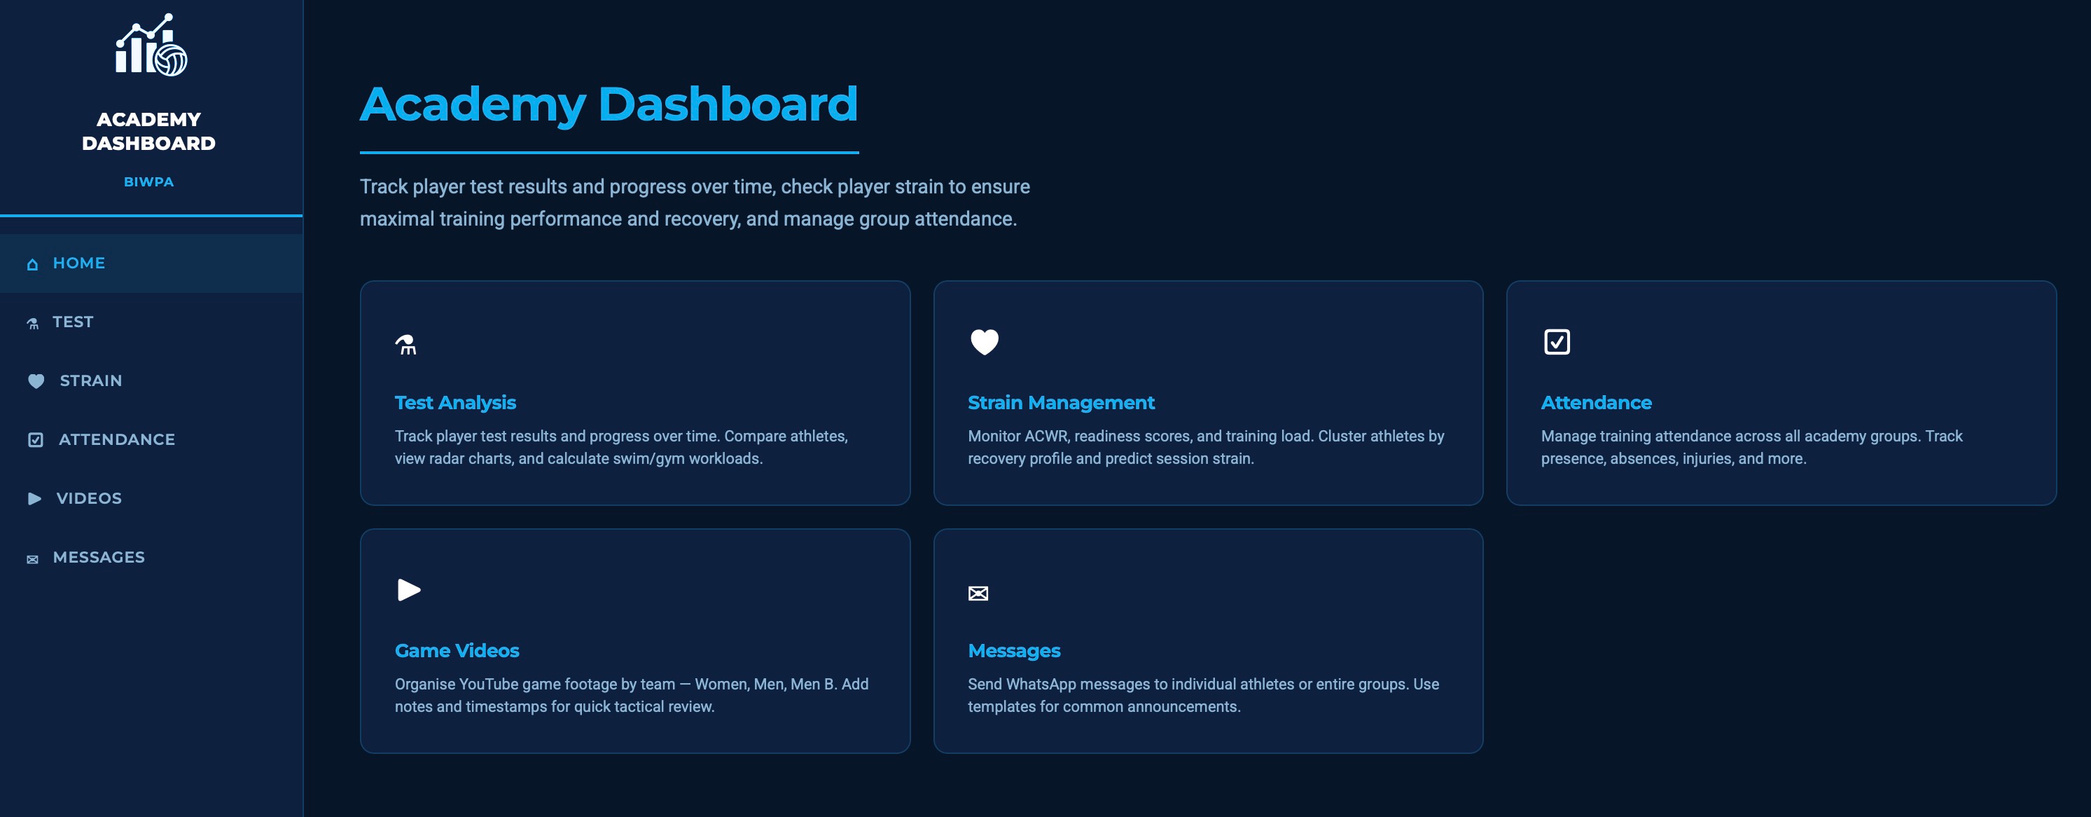
Every athlete's test results tracked over time, compared against teammates, and turned into radar charts and workload targets.
Training load and recovery tracked continuously, with athletes grouped by how they respond so the plan adjusts to the person.
Attendance across every group and session, with absences, injuries, and patterns visible at a glance.
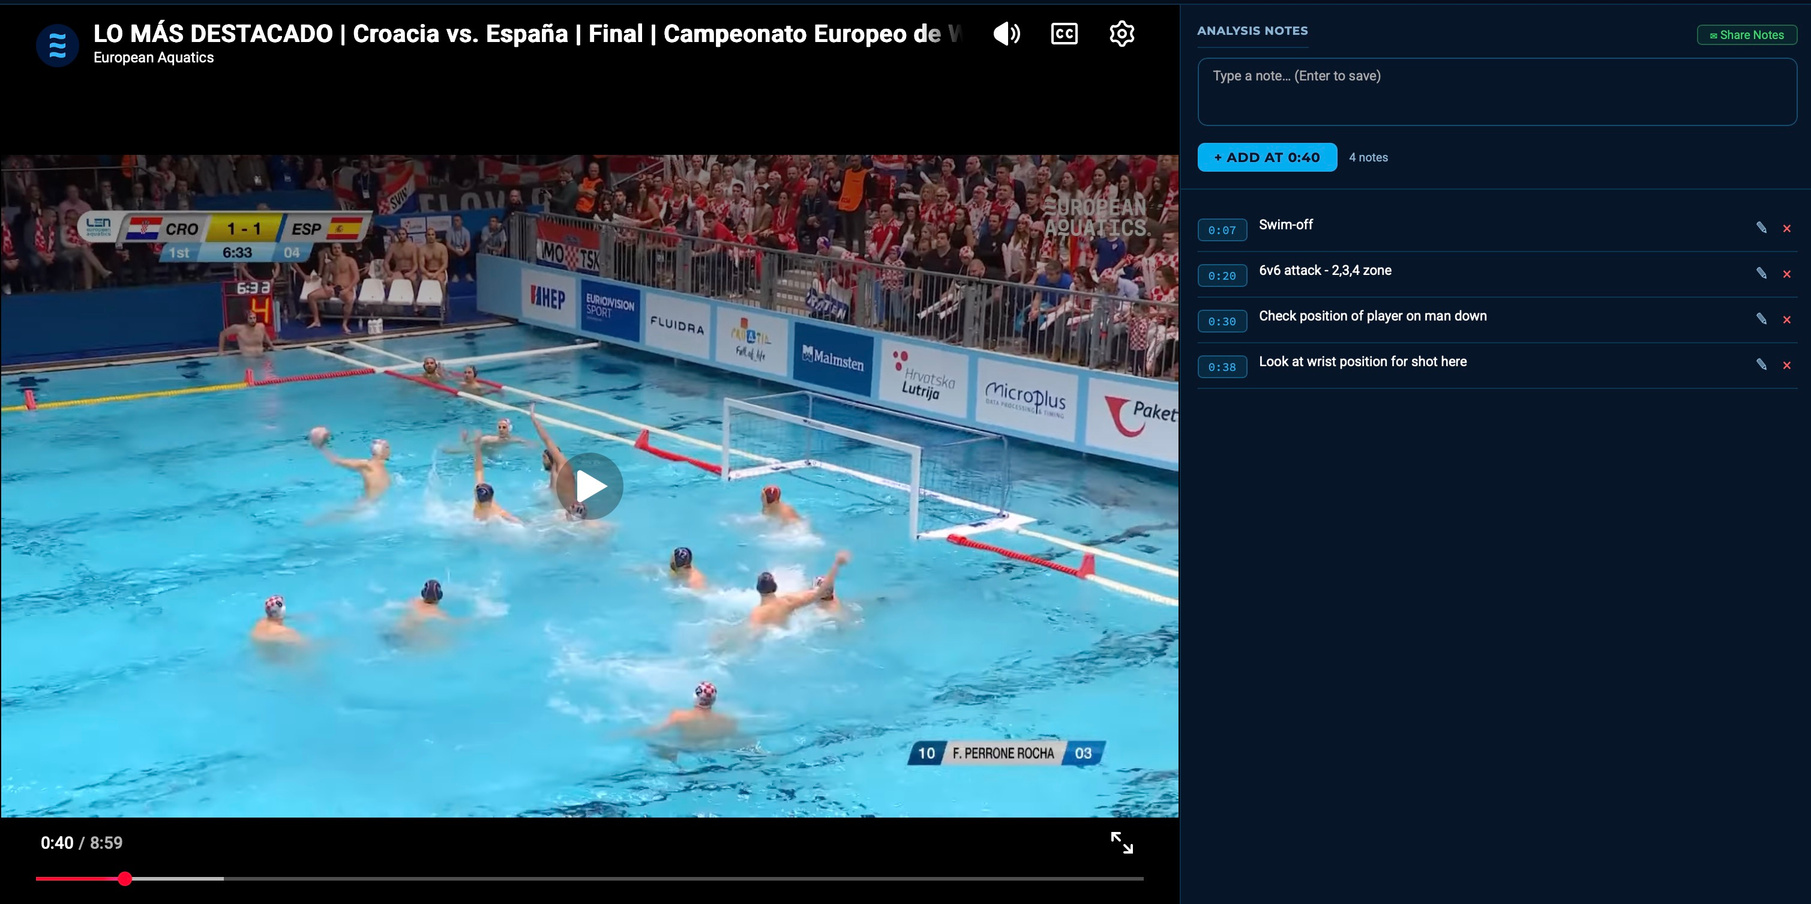
Match footage organised by team, with notes and timestamps attached directly to the moments that matter.
Direct WhatsApp messages to individual athletes or whole groups, with templates for the announcements that repeat every week.
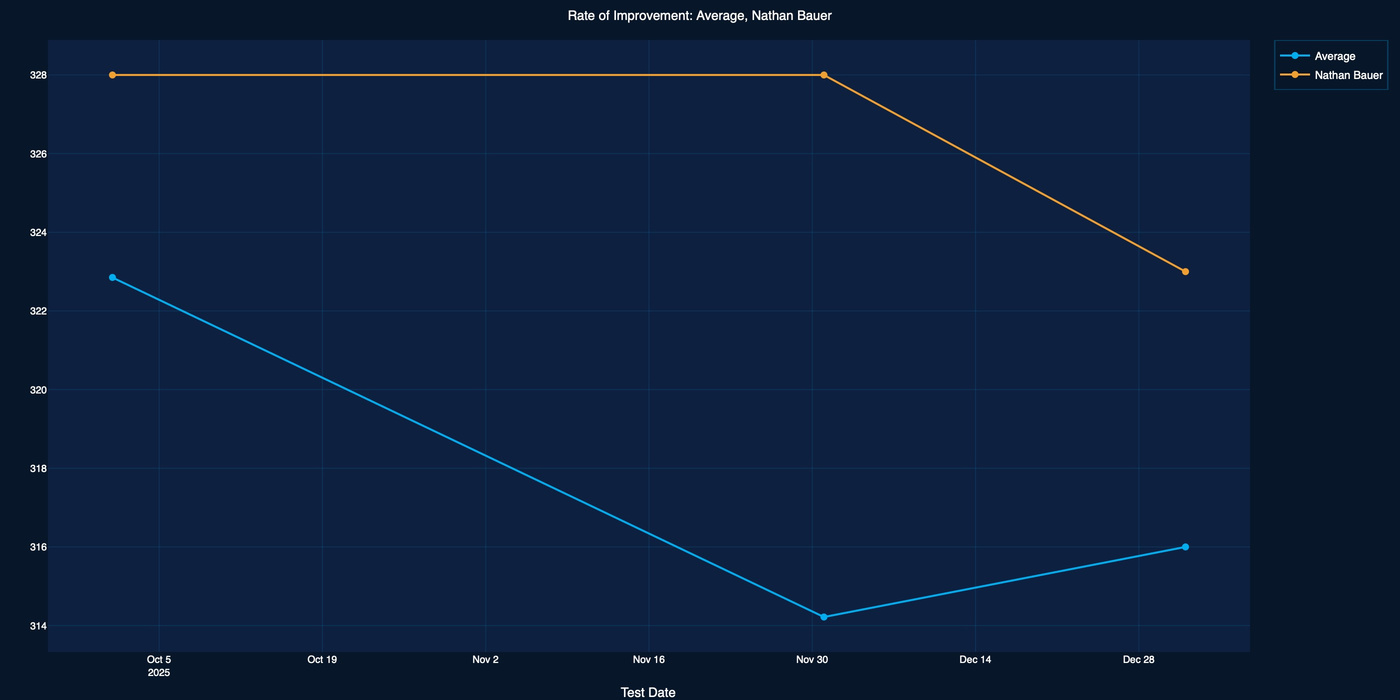
Raw results are logged test by test, then compared against squad averages to show whether an athlete is improving faster or slower than the group.
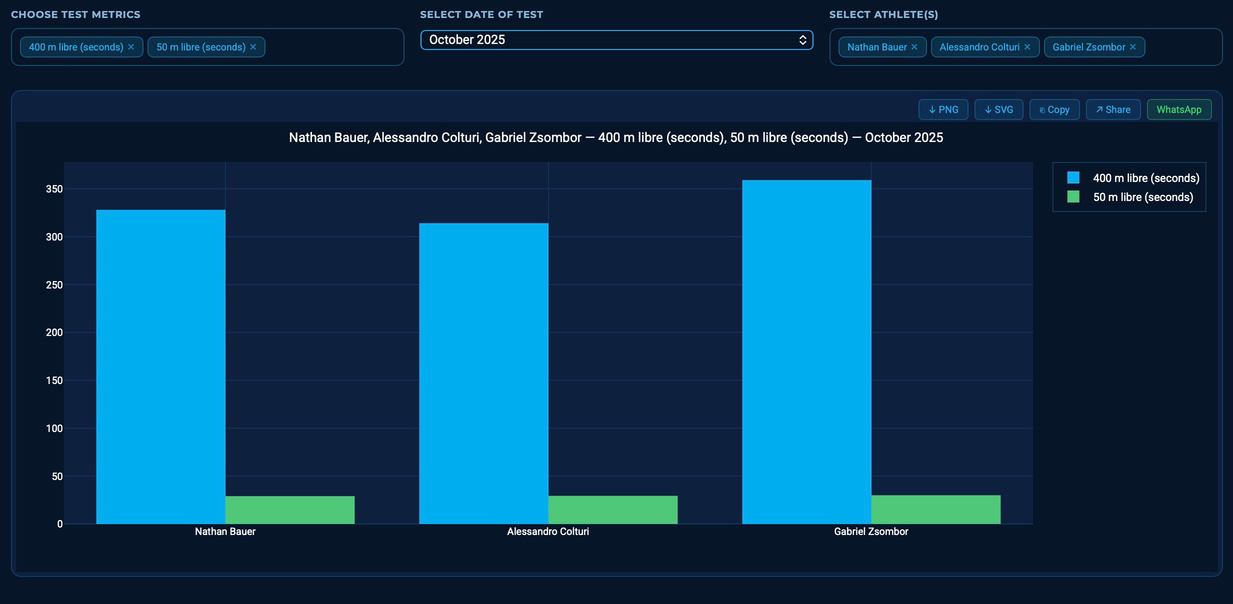
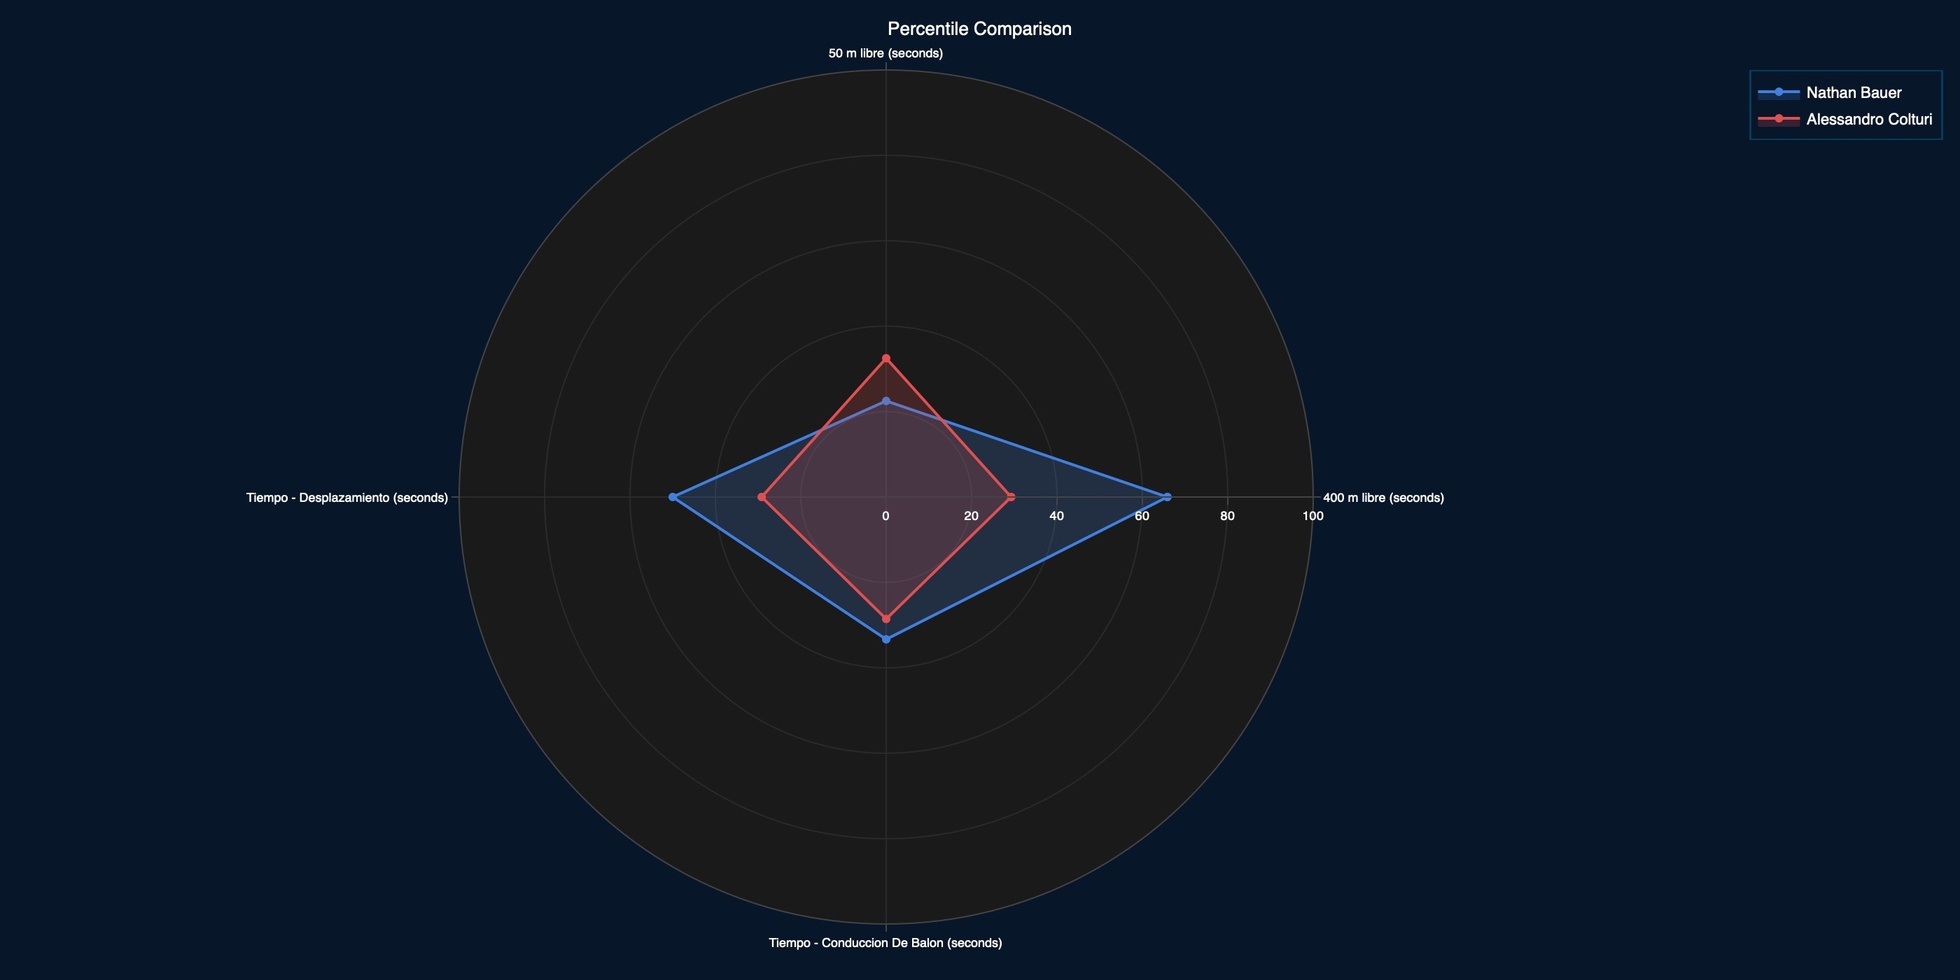
Plotting the same tests against each other turns a table of numbers into a shape, so strengths, weaknesses, and role fit are visible at a glance instead of buried in a spreadsheet.
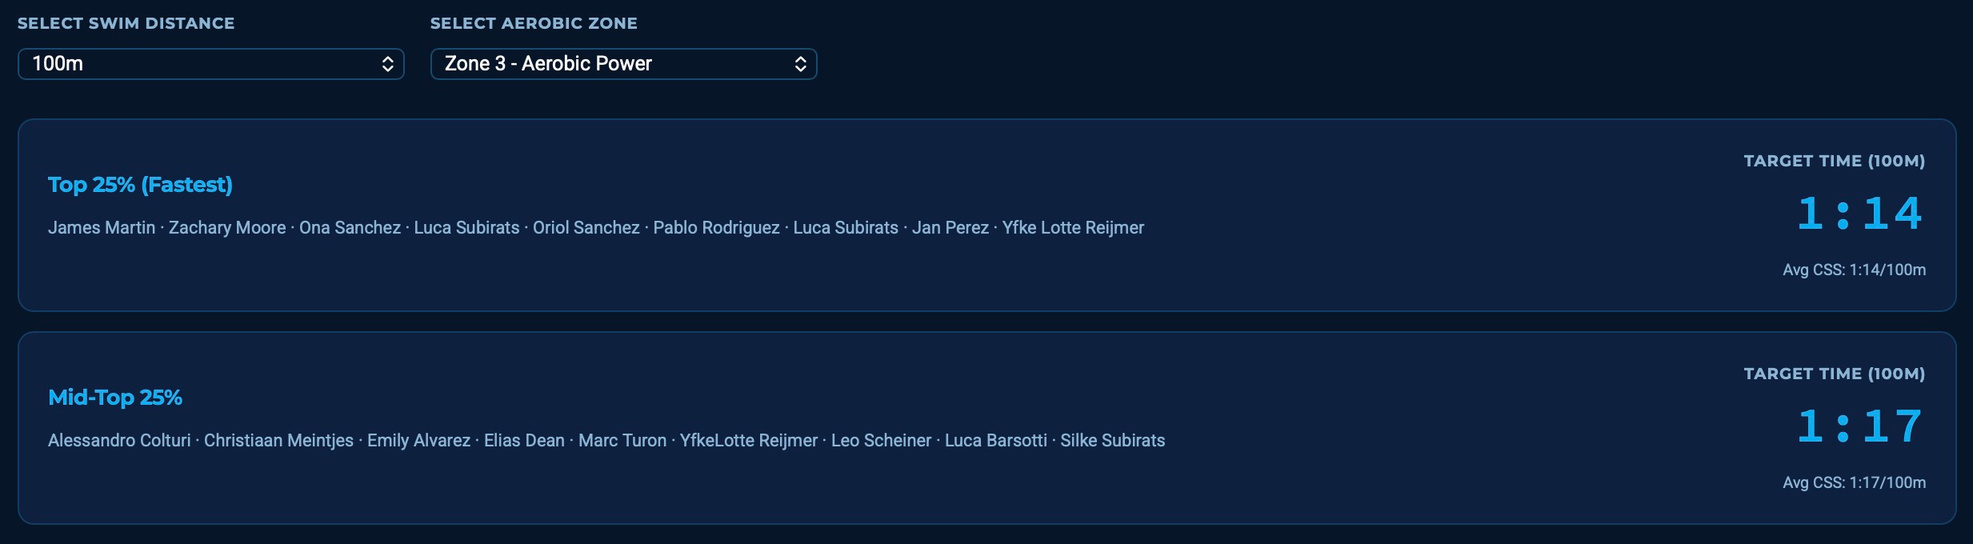
A k-means clustering algorithm groups athletes into ability tiers from their swim test times, then calculates target times for each aerobic zone, so a set written for the whole squad still means something different for each group inside it.
One-rep max and training goal feed a model that outputs an ideal weight range and rep scheme for that exercise, whether the aim is strength, hypertrophy, or endurance.

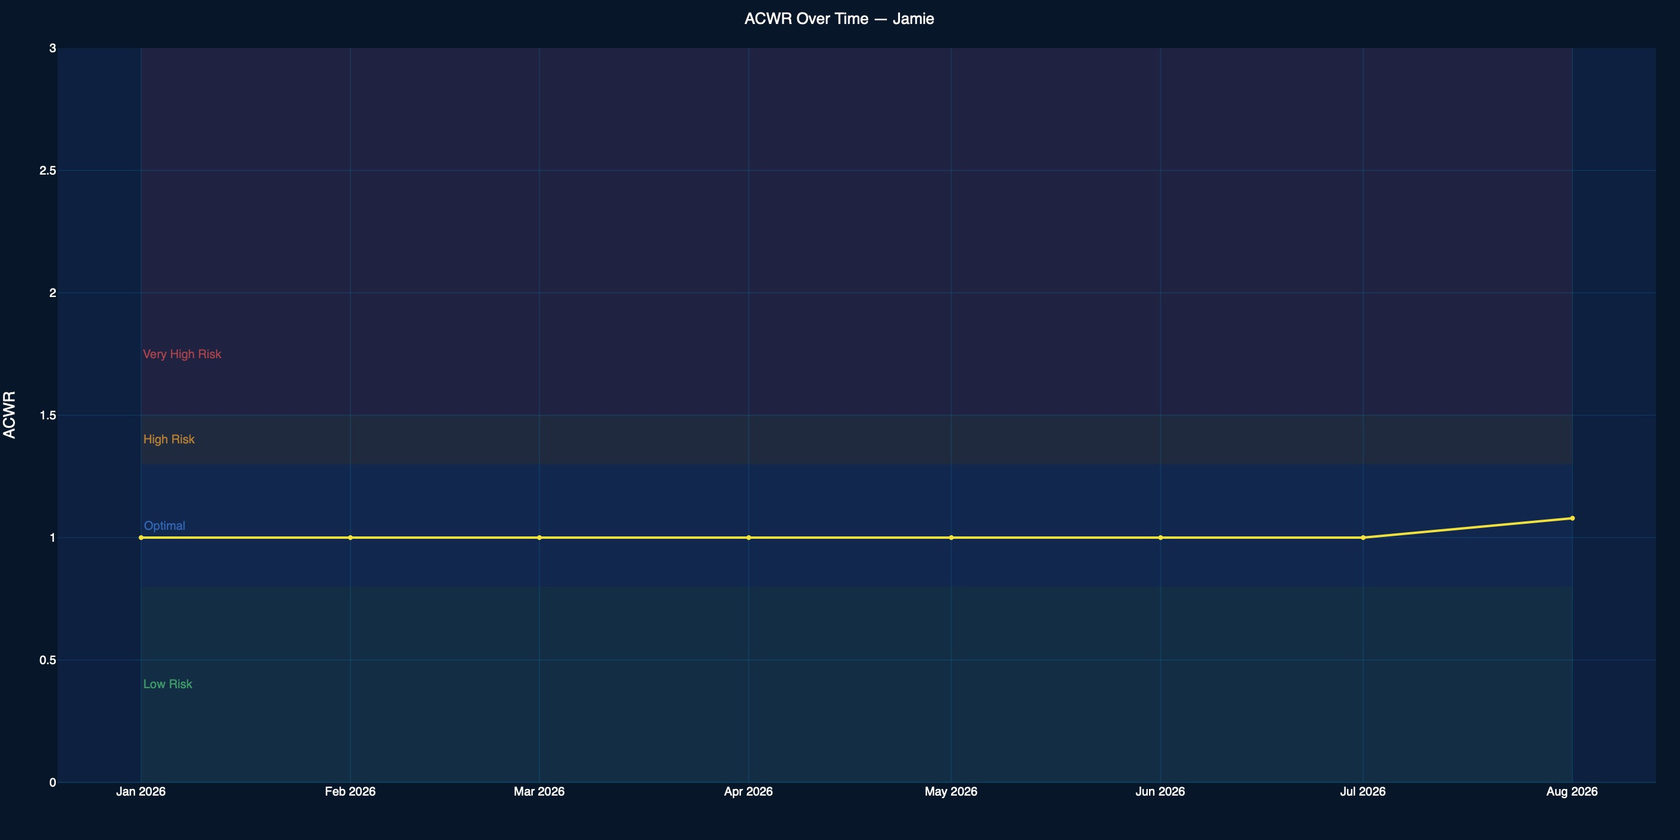
Acute-to-chronic workload ratio is tracked for every athlete against low, optimal, high, and very high risk bands, so a training block that's crept into dangerous territory shows up on the chart before it shows up as an injury.
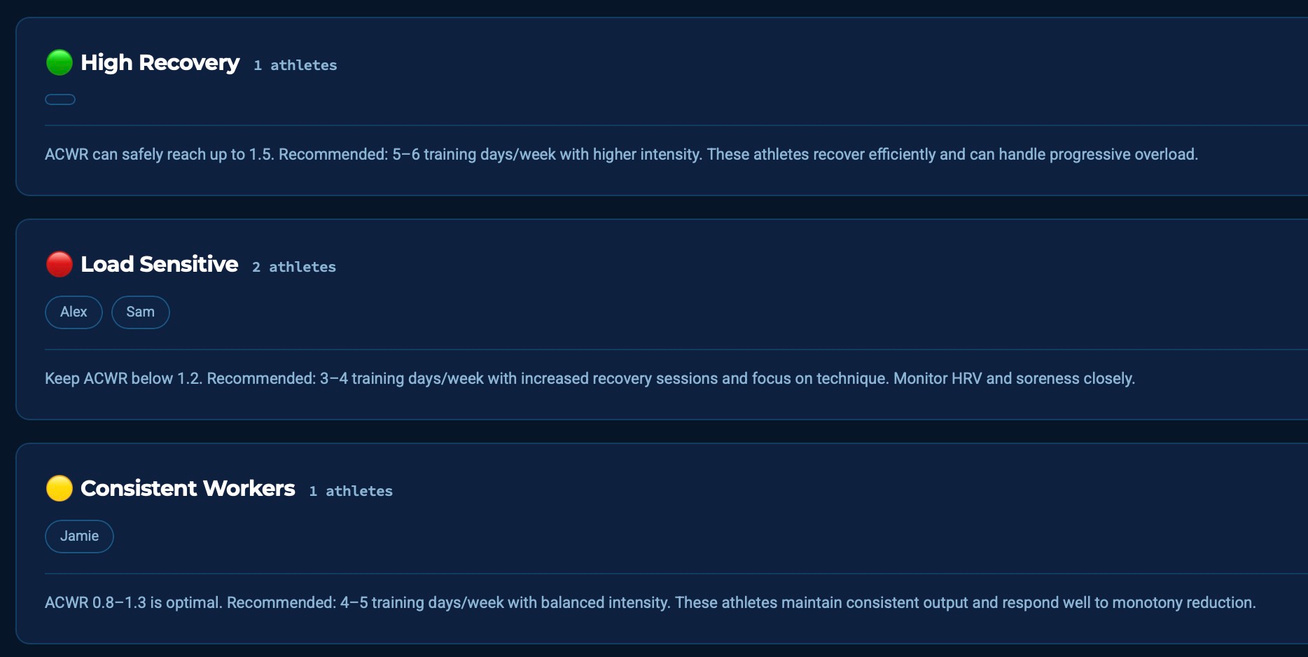
Athletes cluster automatically into recovery profiles, from load-sensitive to high-recovery, so the same training week can be scaled differently for each group without singling anyone out.
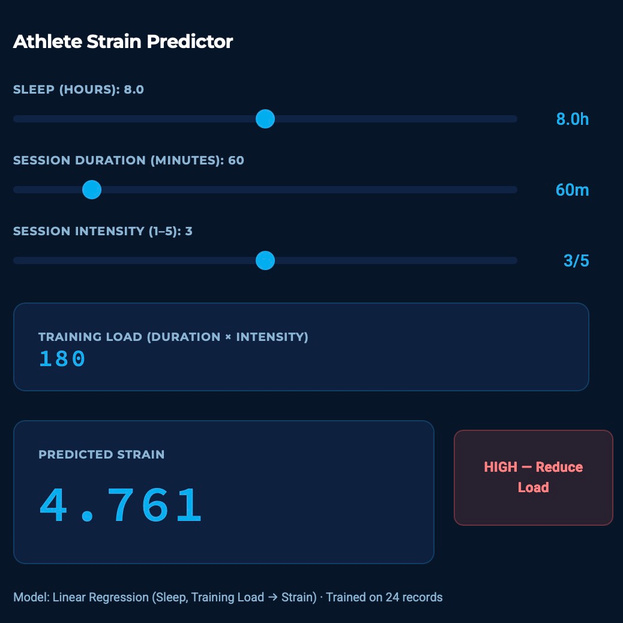
A separate model takes sleep, session duration, and intensity, and predicts the strain a session is likely to produce, flagging it before it happens rather than after.
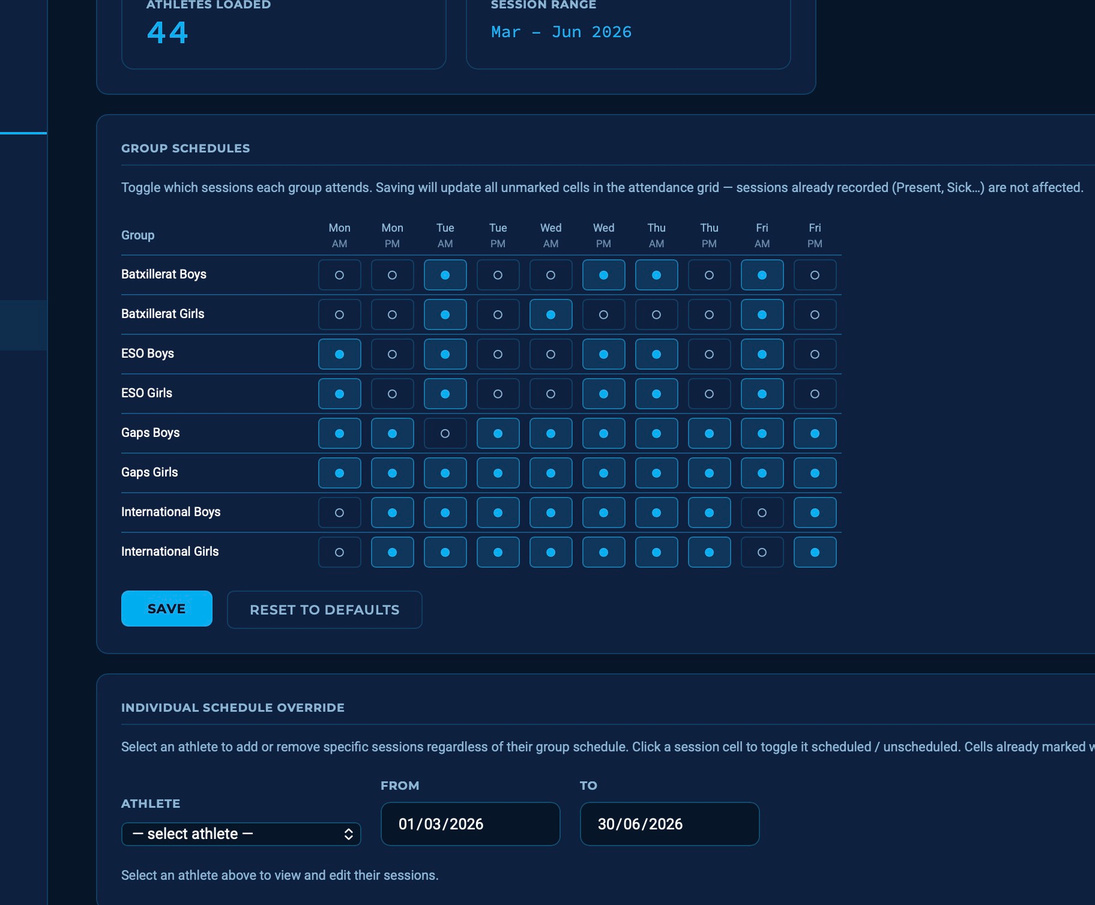
Group schedules set which sessions each squad attends, individual overrides handle the exceptions, and the resulting attendance grid tracks presence, absences, and injuries across every group automatically.
Game video sits inside the same dashboard, with timestamped notes attached directly to the clip, so a tactical point or a technical cue is tied to the exact moment it happened rather than a separate document.
The same dashboard is linked up to WhatsApp, so a note on a clip or a change to a session can go straight to an athlete or a whole group without leaving the platform.
Reach out for more information or a full product demo.
Every academy tracks things differently, so the dashboard isn't one-size-fits-all — sections, metrics, and workflows are built or adjusted around how your club actually works.
Get in touch