Timeout Efficiency
Measure whether tactical timeouts shift momentum. Scoring rate, possession, and goal concession tracked before and after each timeout.
From raw data to coaching decisions
Every match generates data most clubs never see. Water Polo Insights extracts it, maps it, and delivers it in a format your staff can use before the next training session.
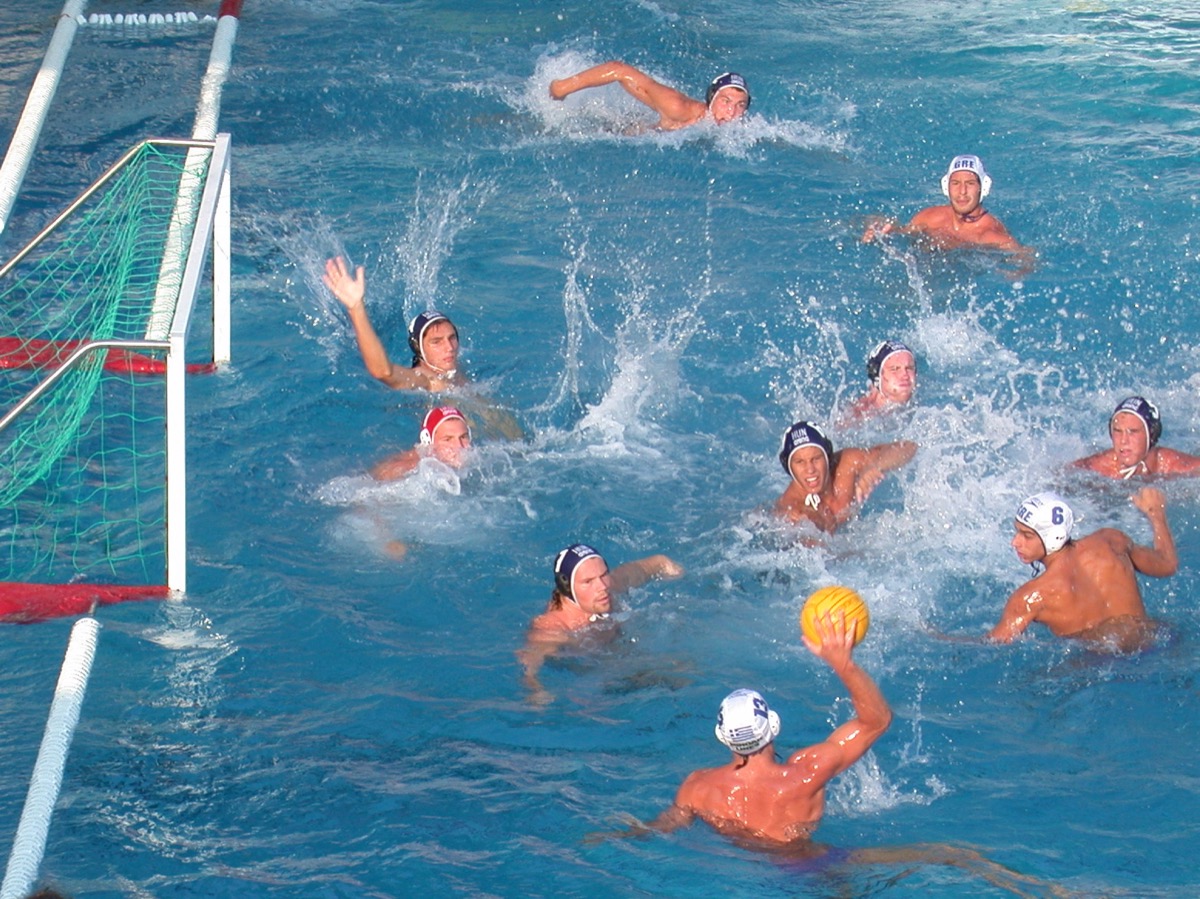
View stats from games at the highest level — top competitions, tracked and broken down match by match, free for anyone to explore.
Italy
9
Full Time
Hungary
7
Goals by Period
Match Statistics
Water Polo Stats Dashboard
Live tool — upload your own CSV to analyse any match
Every report is built from visuals like these — the shot maps, pass networks, momentum tracking, and player comparisons that come with each match analysed.
Shot Frequency Heatmap
n=148 shotsPass Network — Attacking Phase
n=186 passesMomentum Tracking — Match Overview
rolling 5 eventsPlayer Comparison — Radar
2 playersGoal Frame — Shot Location
n=18 shotsGoals by Event Type — Home vs Away
Home vs AwayMeasure whether tactical timeouts shift momentum. Scoring rate, possession, and goal concession tracked before and after each timeout.
Goals, saves, goals under pressure, xG created, and turnovers tracked per player — the individual metrics available directly from the dashboard.
Shot location, distance, type, and outcome mapped per match. Identify recurring angles or positions that require targeted training focus.
Shot area analysis, in-game momentum, success rates by shot type, key player comparisons, and pass networks — structured into a report coaches can use the same week.
Not every match already has usable stats sitting online. For competitions and fixtures where data is scarce, WPI collects it manually with its own Data Input Dashboard, a purpose-built tracker for logging every attack, shot, and exclusion straight from match footage.
Data Collection
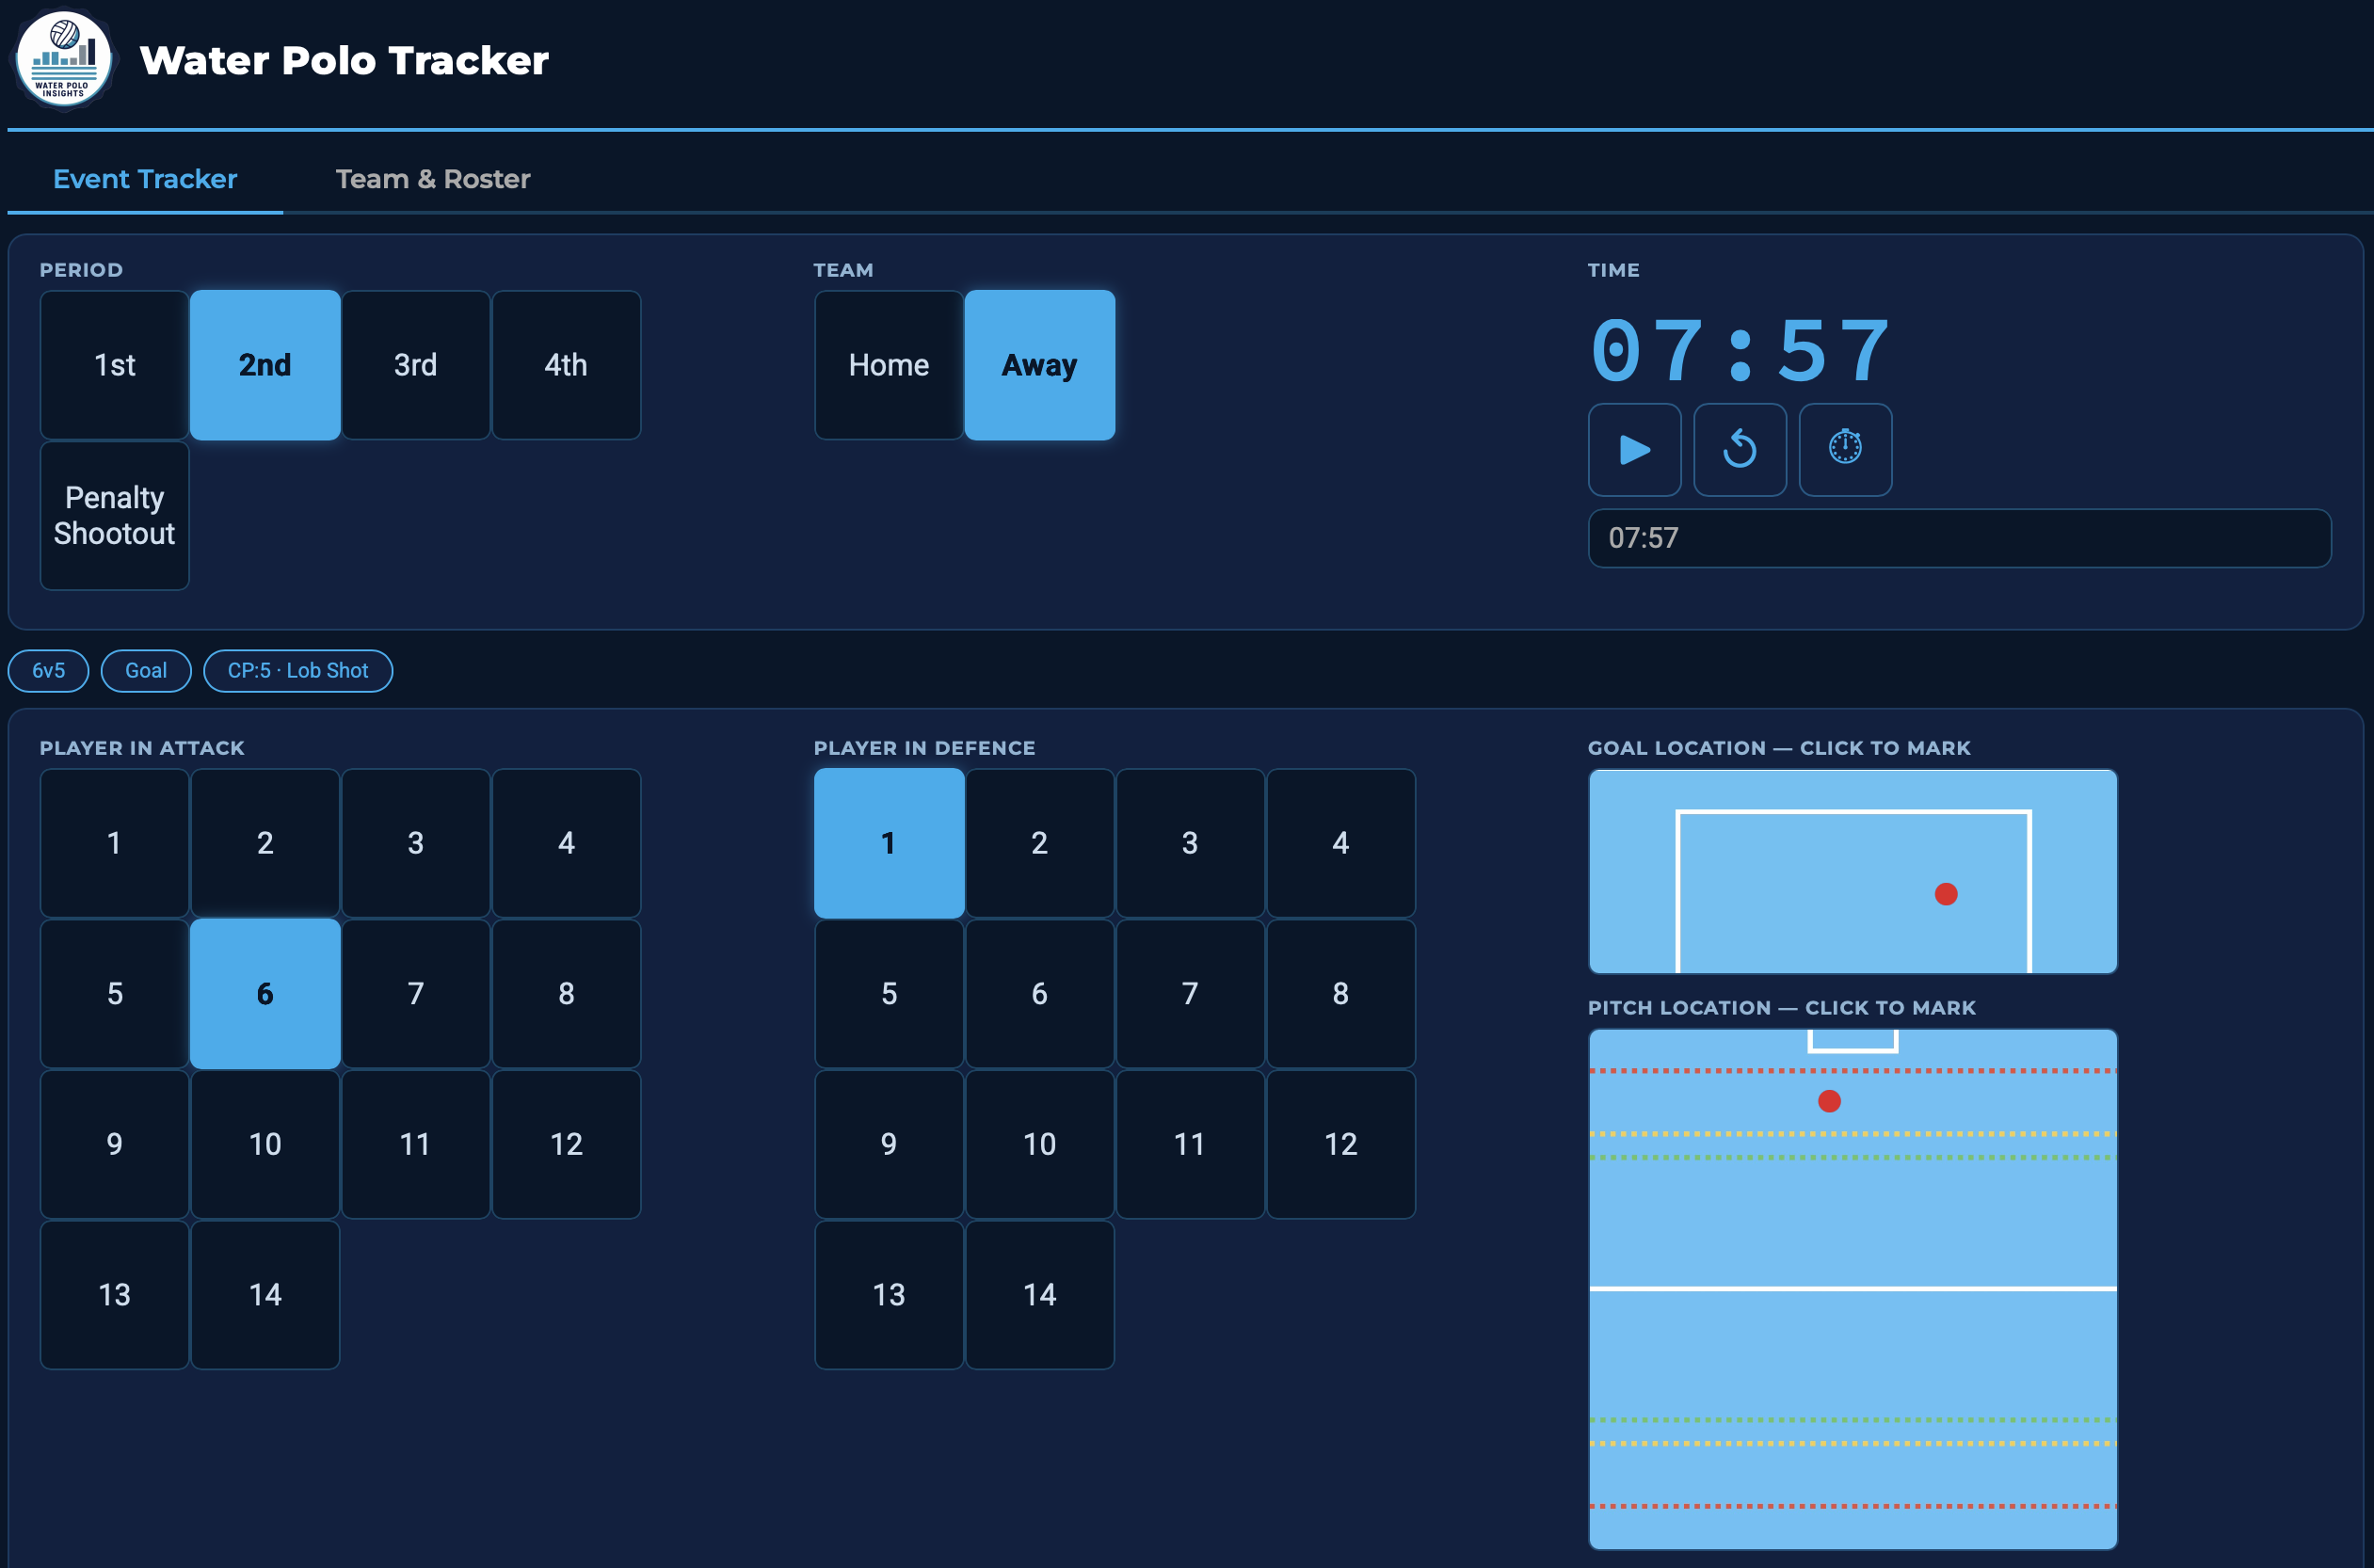
Built on real professional matches — data and video used together to find a genuine tactical edge. The same process is available for your club, built around your own footage and data.
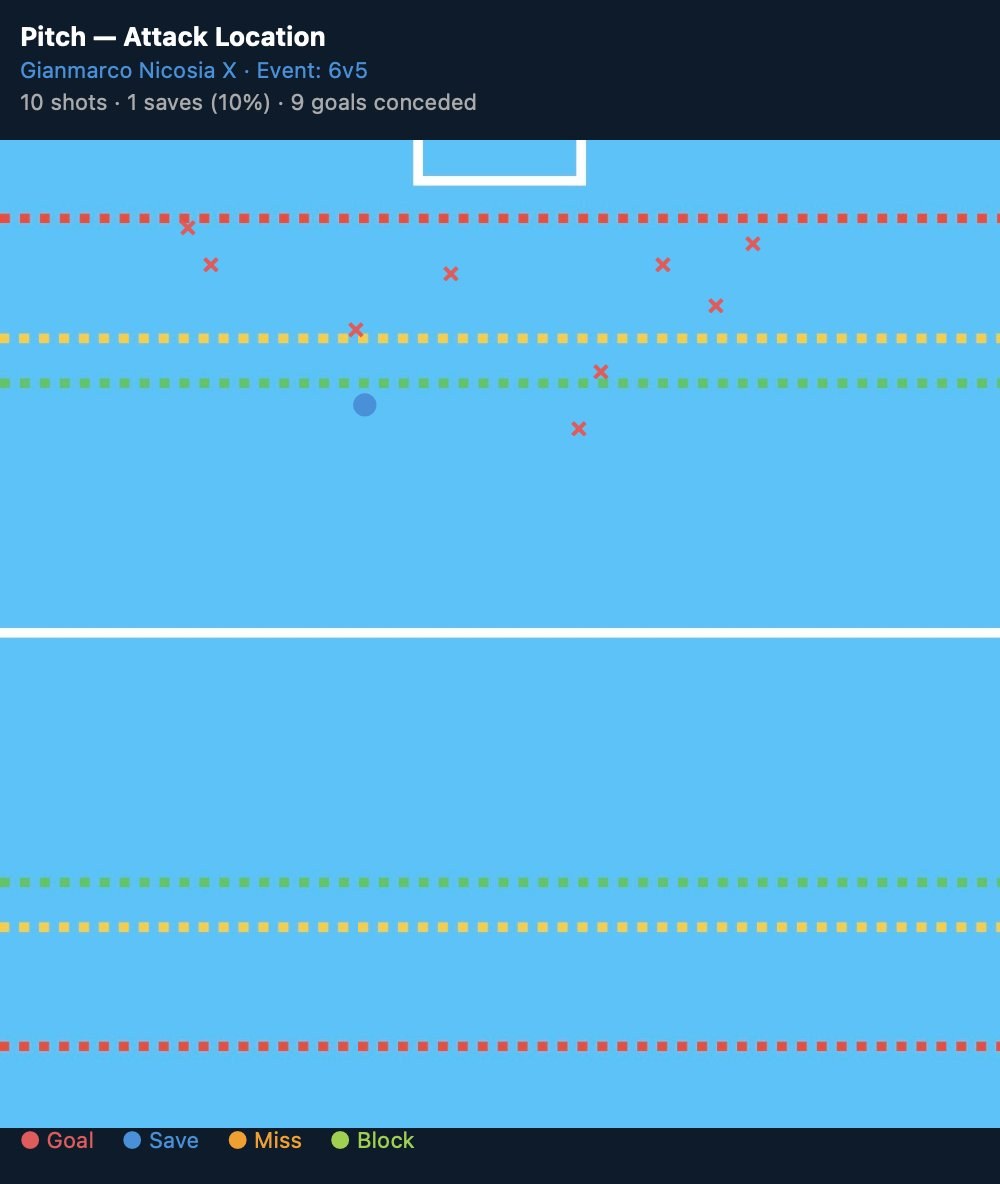
A data-to-video case study tracing why FTC-Telekom's 6v5 power-play produced 4 goals in a loss to Pro Recco and 9 in the rematch win.
Read the case study →
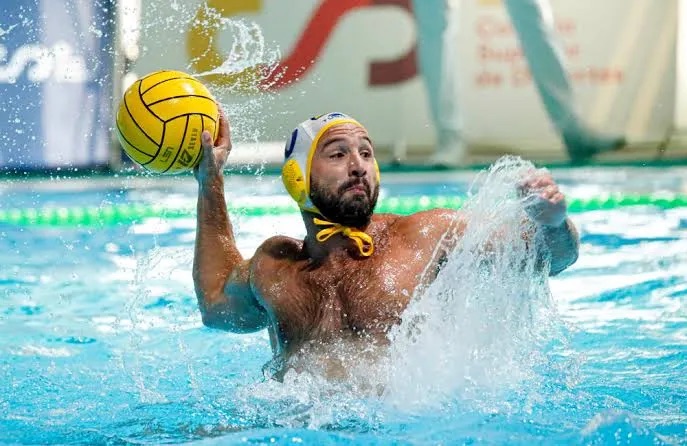
A radar-chart scouting method for finding Felipe Perrone's replacement at Barceloneta, and the four candidates it points to.
Read the case study →
Available as a one-off session, an ongoing programme, or a seasonal retainer — every engagement is scoped to your squad first, with pricing confirmed within a day of getting in touch.
Per match
Per opponent / series
Seasonal agreement